Splunk And Universal Forwarders Set Up
How to set up Splunk and connect the machines to it
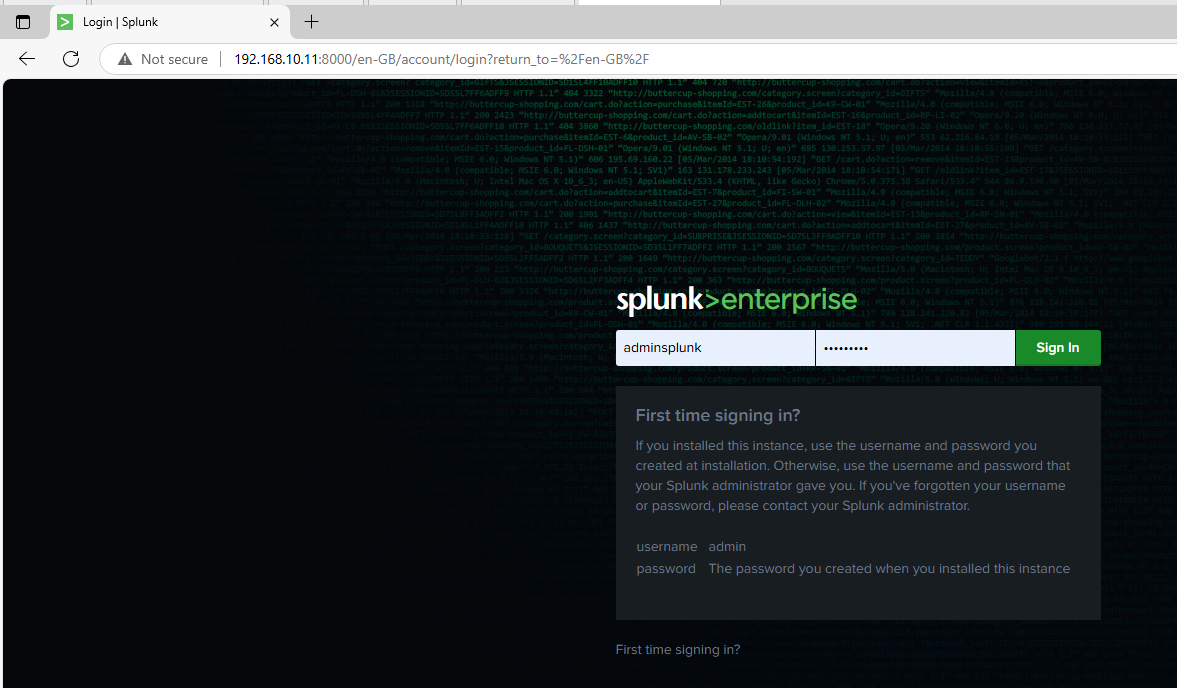
Once we have Splunk installed we will access to the web interface from the W11 machine, going to 192.168.10.11:8000
Once we are in we will need to create indexes to see the information that we want to track.
To do that we will go to Settings -> Indexes
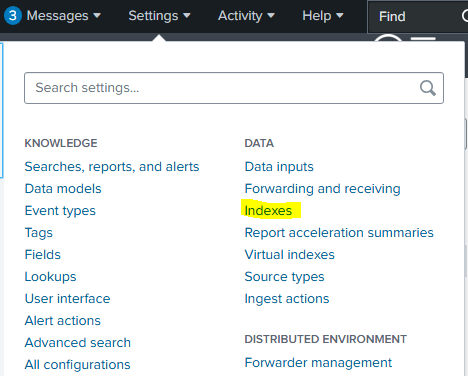
Here we will see a list with all the default indexes, we will go to “New Index” to create our custom ones.
We will create them and just fill the name for now leaving the other camps as default:
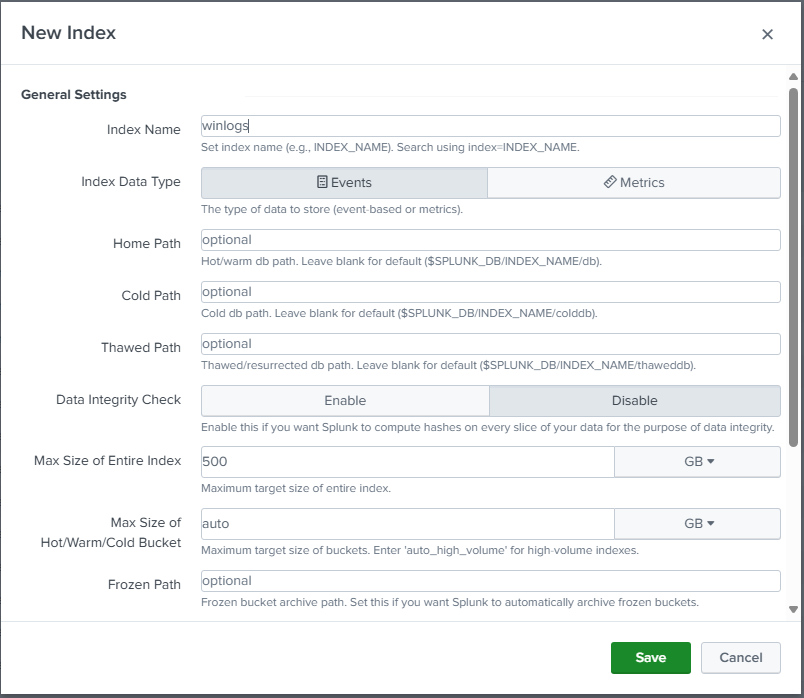
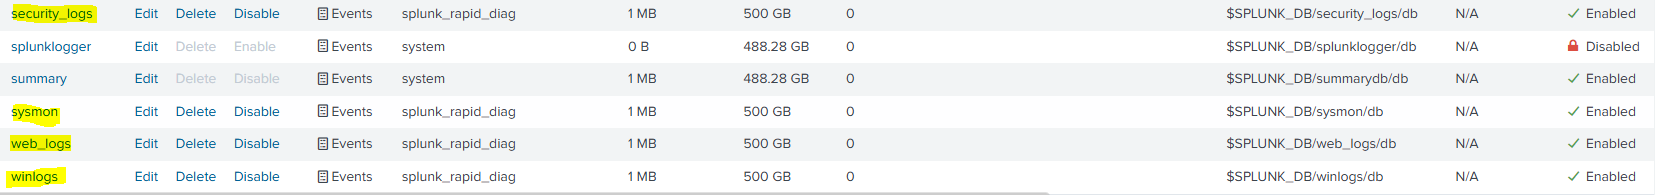
I will create the next indexes:
-winlogs (Windows Event Logs) -web_logs (Web Server Logs) -security_logs (General Security Alerts) -sysmon (Sysmon logs from W11 or DC)
Once we have this we will have to install the Universal Forwarders on the machines.
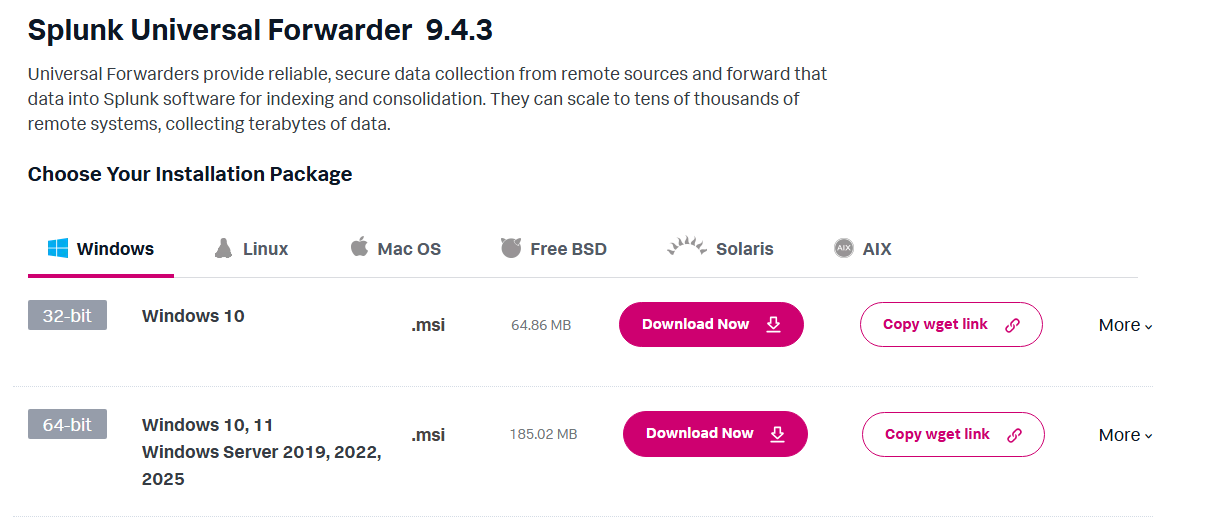
To install it in the W11 it’s straight forward, we just go to the splunk website, login, look for the download and just download it in the machine.
It will then ask us for the admin login:
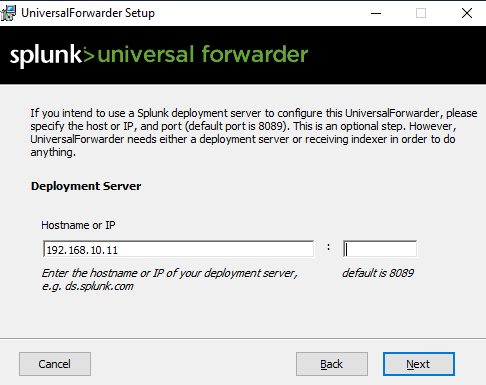
After setting up the admin account it will ask us for the deployment server IP:
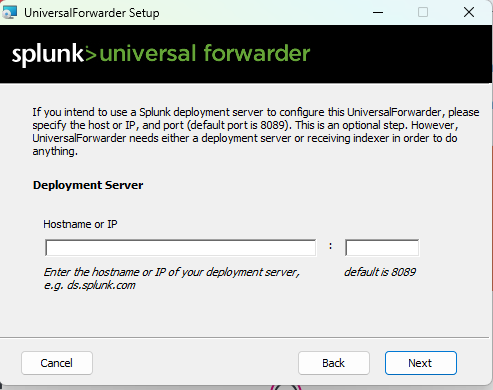
For now we will not set up any deployment server or receiving indexer, just click on continue.
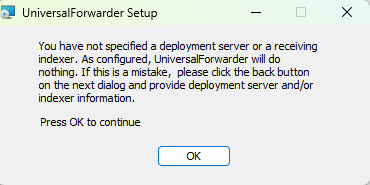
Will get a warning but that’s fine:
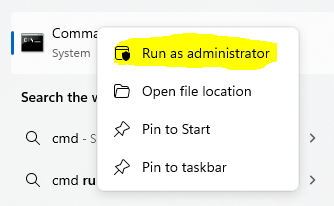
Once we finish the installation we will need to manually set up what are we sending to Splunk, to do that we will open a command prompt instance as an admin:
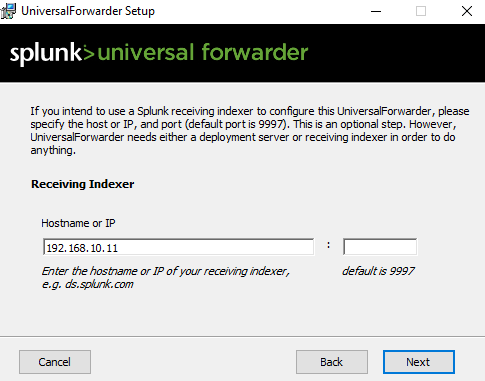
We will then add where will we be sending the information with the next command:
1
splunk add forward-server 192.168.10.11:9997 -auth admin:yourpassword
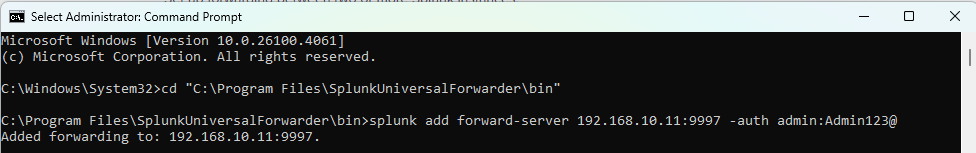
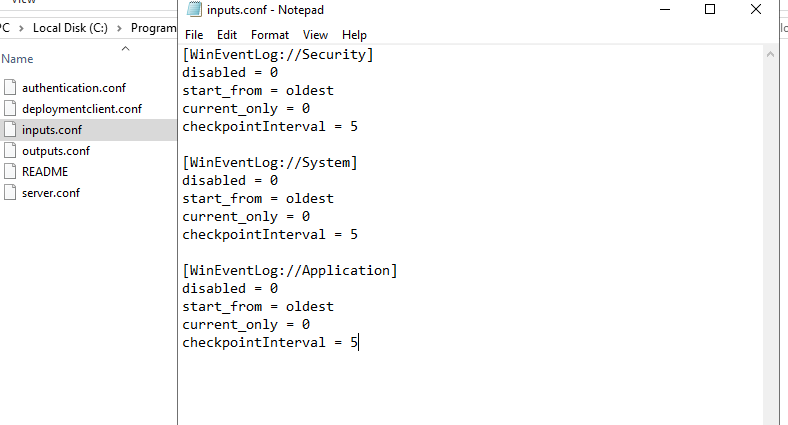
And now we have to select what information are we going to be sending, to do that we will go to “C:\Program Files\SplunkUniversalForwarder\etc\system\local” and if it’s not created yet, we will create the “inputs.conf” file.
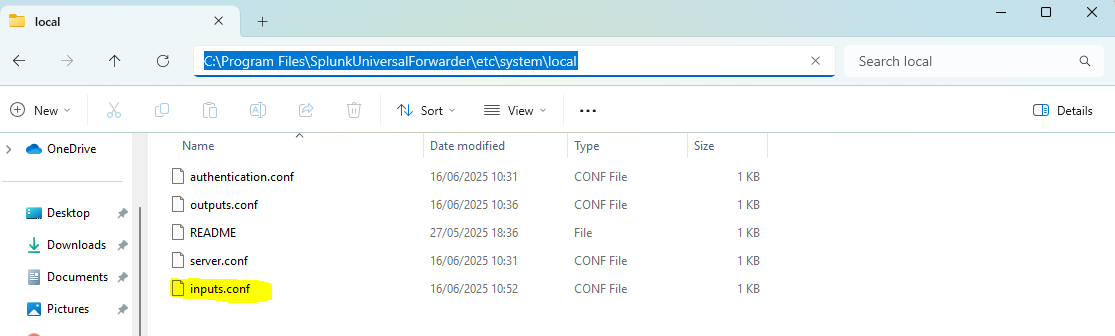
And then we will proceed to add what we want to send, which will be Security, System and Application Logs:
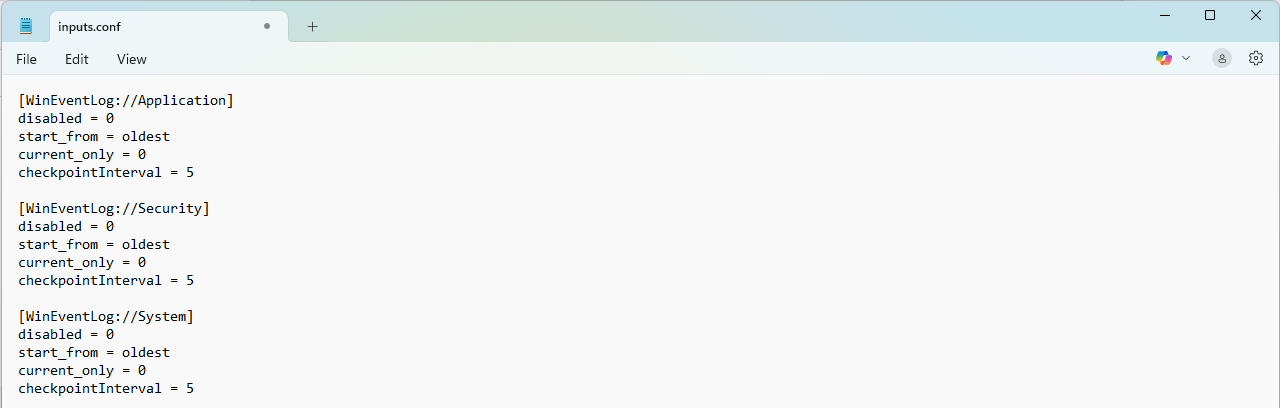
This is what we need to add:
1
2
3
4
5
6
7
8
9
10
11
12
13
14
15
16
17
18
[WinEventLog://Application]
disabled = 0
start_from = oldest
current_only = 0
checkpointInterval = 5

[WinEventLog://Security]
disabled = 0
start_from = oldest
current_only = 0
checkpointInterval = 5

[WinEventLog://System]
disabled = 0
start_from = oldest
current_only = 0
checkpointInterval = 5
Now we are all set up in the W11, we will go to Splunk and create the receiver, for that we will go to Settings -> Forwarding and receiving:
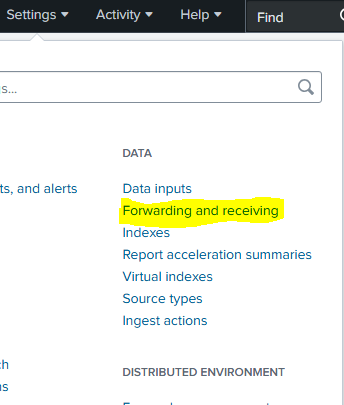
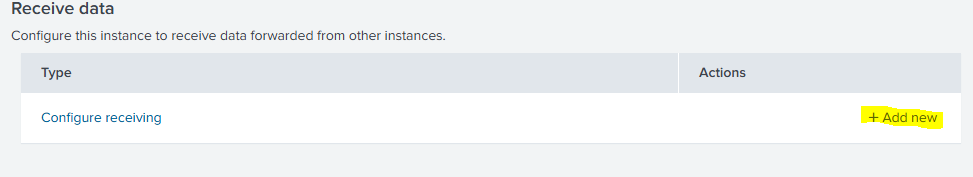
Then we will go to Recieve data and we will configure a new one:
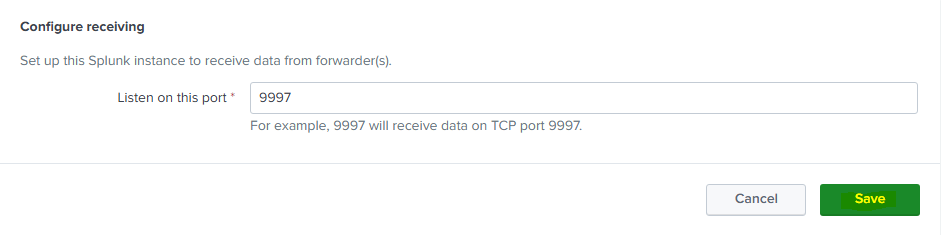
We will then configure it to listen on port 9997:
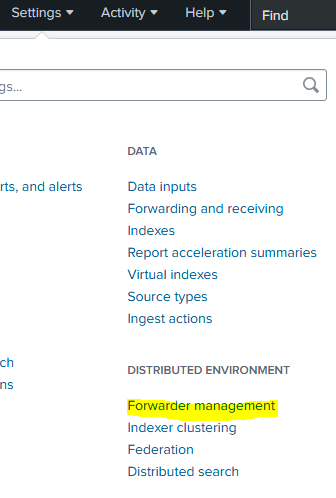
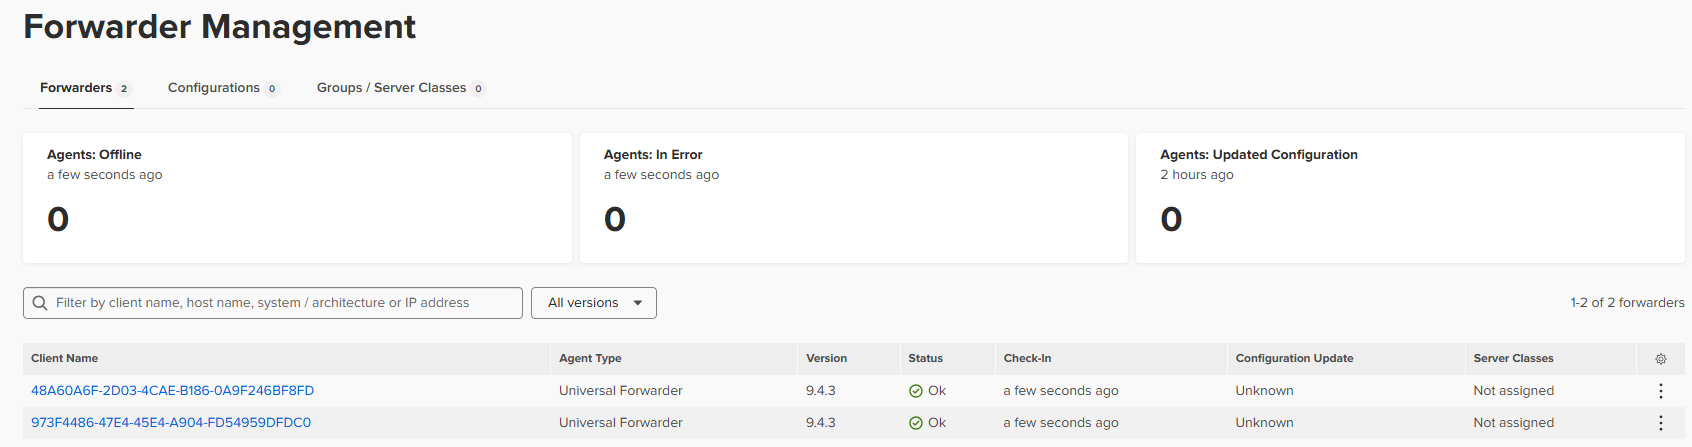
Once we have it running we will go to “Settings -> Forwarded management” to check if we are receiving something:
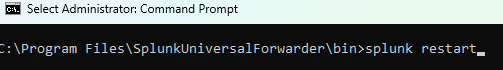
I wasn’t receiving anything so went into the CMD and used “splunk restart” to apply the latest configurations.
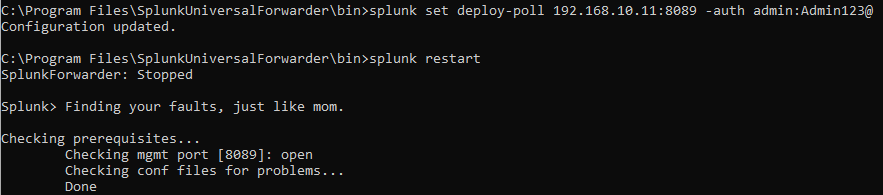
Still not working, I found out I forgot to tell the UF who the deployment server is, and for that we will need to run:
1
2
splunk set deploy-poll 192.168.10.11:8089 -auth admin:yourpassword
splunk restart
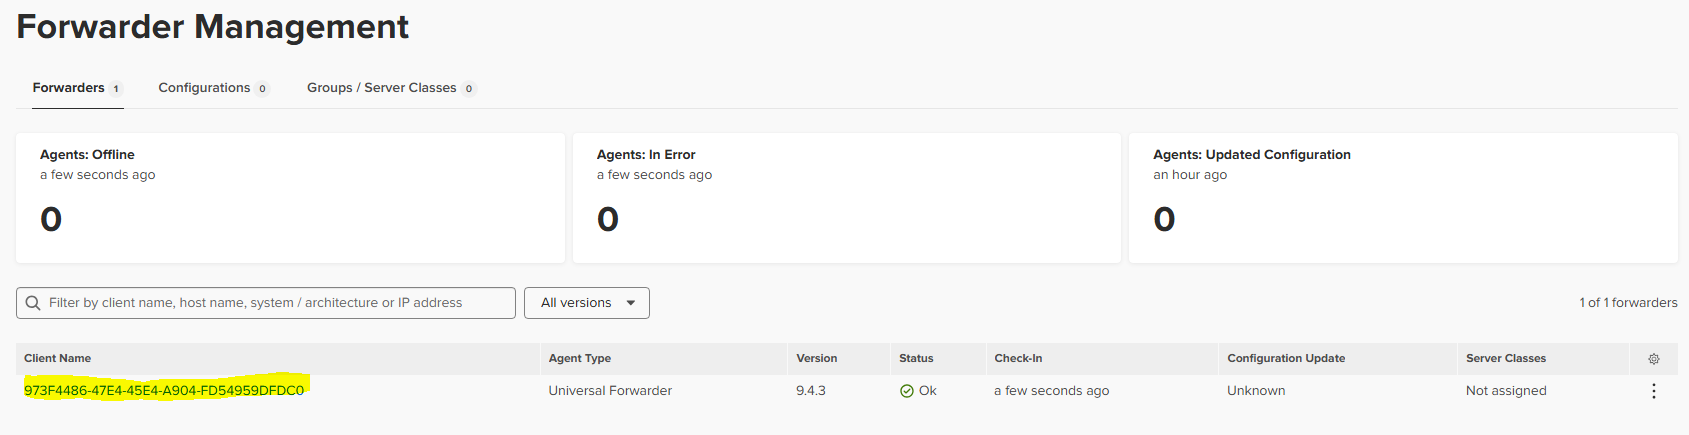
After that we will see that now it shows on the Forwarded management:
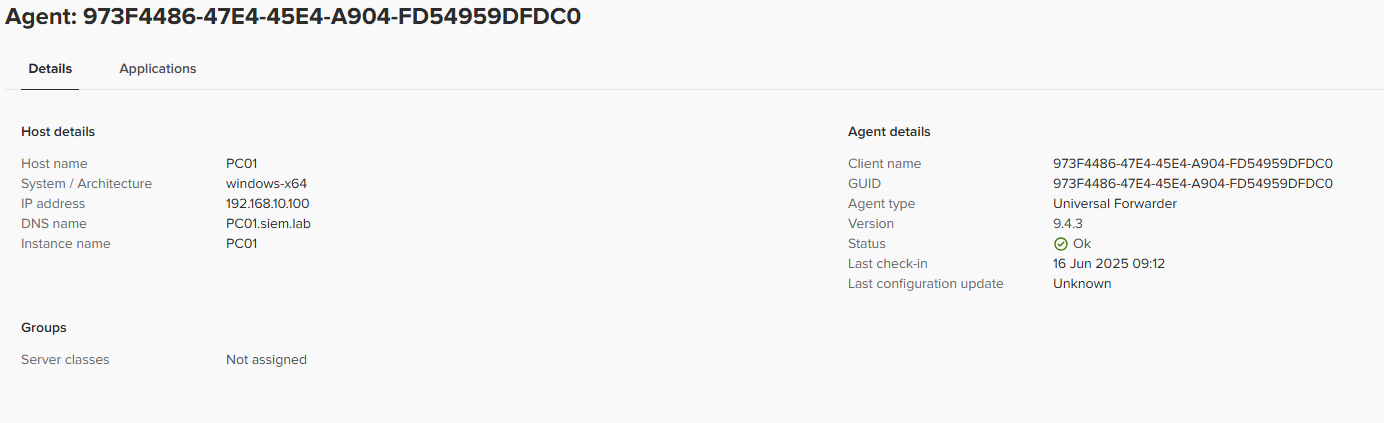
We can click on it to see the details aswel:
##Install in WS-2019
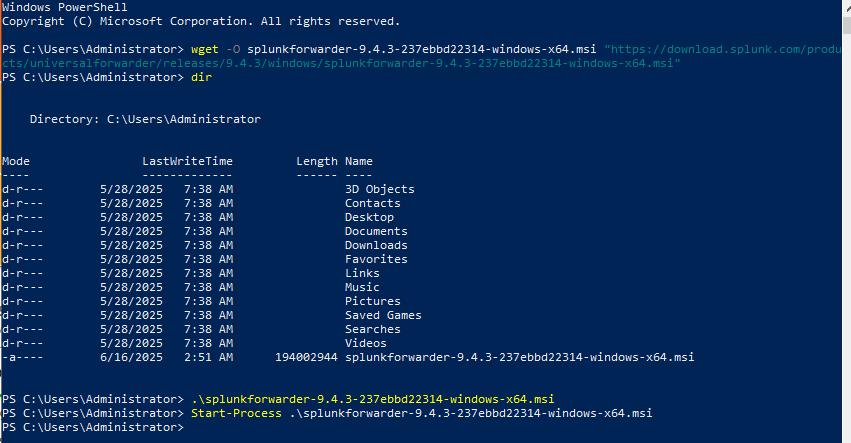
Now we will install it in WS-2019, for that we will go to the Splunk website and get the wget link, once we have it we will paste it in PowerShell and start it:
Once we have it running, we will now set the Deployment Server and the Receiving Indexer to not have the same problems as before:
That way is much easier, we can see how we already have it on the Forwarded Management interface:
Now we just need to set up the information we will be sending, for that we will do exactly the same as before, create the “inputs.conf” file and fill it:
##Install in Web Server (Ubuntu)
To install it in the Web Server I did SSH from the W11 machine and got the download link from the website:
1
wget -O splunkforwarder.tgz 'https://download.splunk.com/products/universalforwarder/releases/9.2.1/linux/splunkforwarder-9.2.1-<build-id>-Linux-x86_64.tgz'
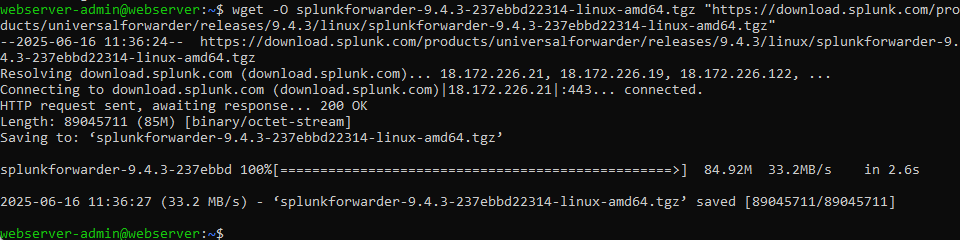
Then we will extract, move the folder and start it for the first time:
1
2
3
tar -xvzf splunkforwarder.tgz
sudo mv splunkforwarder /opt/splunkforwarder
sudo /opt/splunkforwarder/bin/splunk start
We will accept the license and create the admin user.
We will then add the servers:
1
2
sudo /opt/splunkforwarder/bin/splunk add forward-server 192.168.10.11:9997 -auth admin:yourpassword
sudo /opt/splunkforwarder/bin/splunk set deploy-poll 192.168.10.11:8089 -auth admin:yourpassword
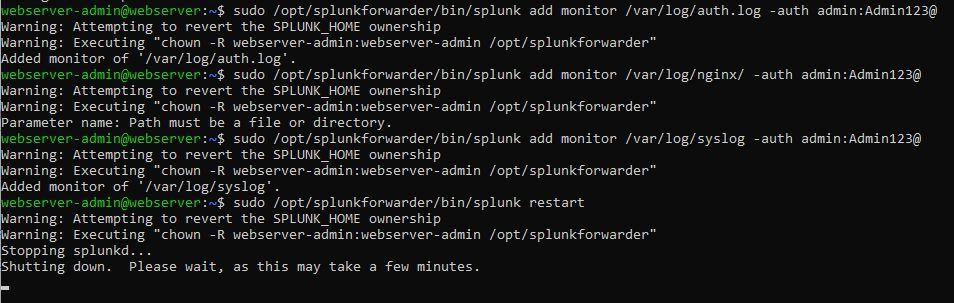
We will then add the monitoring inputs:
1
2
3
sudo /opt/splunkforwarder/bin/splunk add monitor /var/log/auth.log -auth admin:Admin123@
sudo /opt/splunkforwarder/bin/splunk add monitor /var/log/nginx/ -auth admin:Admin123@
sudo /opt/splunkforwarder/bin/splunk add monitor /var/log/syslog -auth admin:Admin123@
Once they’re added we can proceed to restart splunk with:
1
sudo /opt/splunkforwarder/bin/splunk restart
After that we would have it all set up for the webserver aswel.